Grid-Hawk is a sophisticated software platform designed for the advanced visualization and analysis of electricity consumption data, collected from a network of smart meters and transformers via an advanced monitoring system utilising precise sensors at the distribution sub station and RF communication network deployed in the field.
It is imperative to monitor distribution networks for anomaly detection in order to prevent energy losses, enhance system security and guarantee operational efficiency. The system architecture depicted in figure given below is designed to monitor high current draw loads in power distribution networks and to perform anomaly detection in an effective manner. This monitoring system employs an RF mesh network and measurement components integrated in both the distribution transformer and customer meters. After supplying low voltage energy from the distribution transformer, the system continuously measures current values through current sensors.Three-phase current data are sampled at 1.4 kHz using analogue-digital converters capable of 10-bit sampling. The data is collected by data collectors situated at strategic points along the distribution line. RF modems collect energy consumption data and transmit it wirelessly to the data collector. The collected data is transmitted to the central management server via 4G/LTE base station over IPv6 connection. The management server analyses and stores the incoming data and generates alarms when necessary. The sampled data are preprocessed in the next stage and used as input data for the training and testing stages of the machine learning algorithms in this study.

Software Specifications
Visualization Engine: The platform is built upon Grafana, the industry-leading open-source platform for interactive analytics and monitoring. This provides a flexible, powerful, and user-friendly interface for all visualizations.
Data Integration: It utilizes a custom-built AMI (Advanced Metering Infrastructure) Web Service to securely and efficiently retrieve real-time and historical data from the distributed network of RF modules installed on the meters and transformers.
Architecture: The system is architected to handle high-volume time-series data, enabling fluid charting, rapid querying, and complex analysis of large historical datasets without performance degradation. The edge processing unit collects high frequency sensor data to detect and localize losses using AI approaches in the substation area.
Accessibility: As a fully integrated web-based platform, users can access all dashboards and analytics securely from any standard web browser, eliminating the need for local software installation and maintenance.
General Project Features
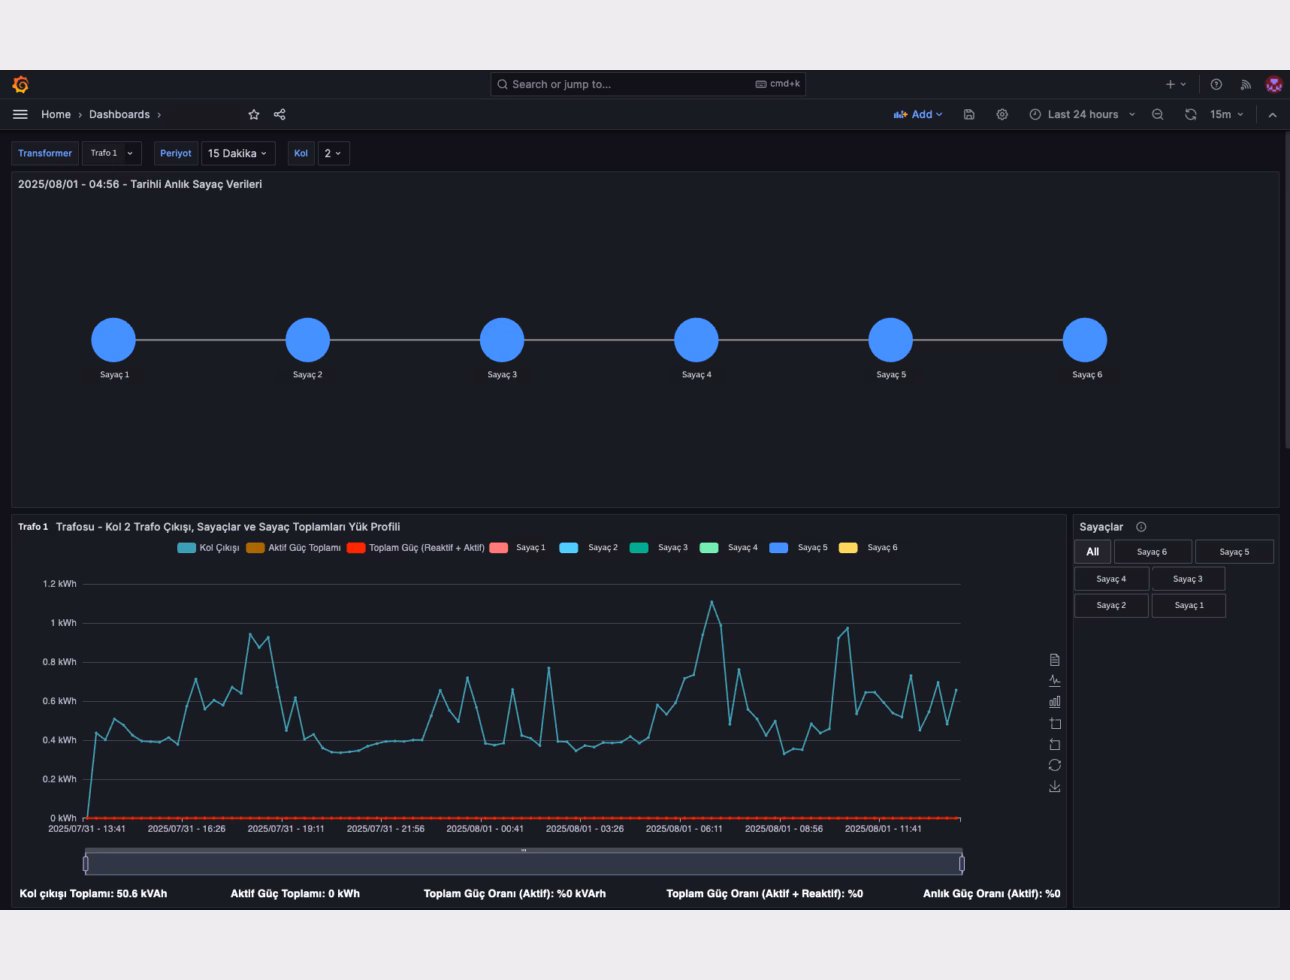
Hierarchical Data View: Users can monitor energy consumption at multiple levels—from a high-level transformer overview down to the load profiles of individual areas and specific end-user meters.
Device Filtering: Dynamically select and isolate data for a single meter, a custom group of meters, or an entire transformer branch for focused or comparative analysis.
Time-Range Control: Select predefined time ranges (e.g., daily, monthly, yearly) or specify custom start and end dates for in-depth historical review and trend analysis.
Customizable Data Granularity: Adjust the data aggregation period on-the-fly, allowing users to view consumption profiles in various intervals (such as 1-minute, 15-minute, or 1-hour blocks) to identify short-term peaks or long-term trends.
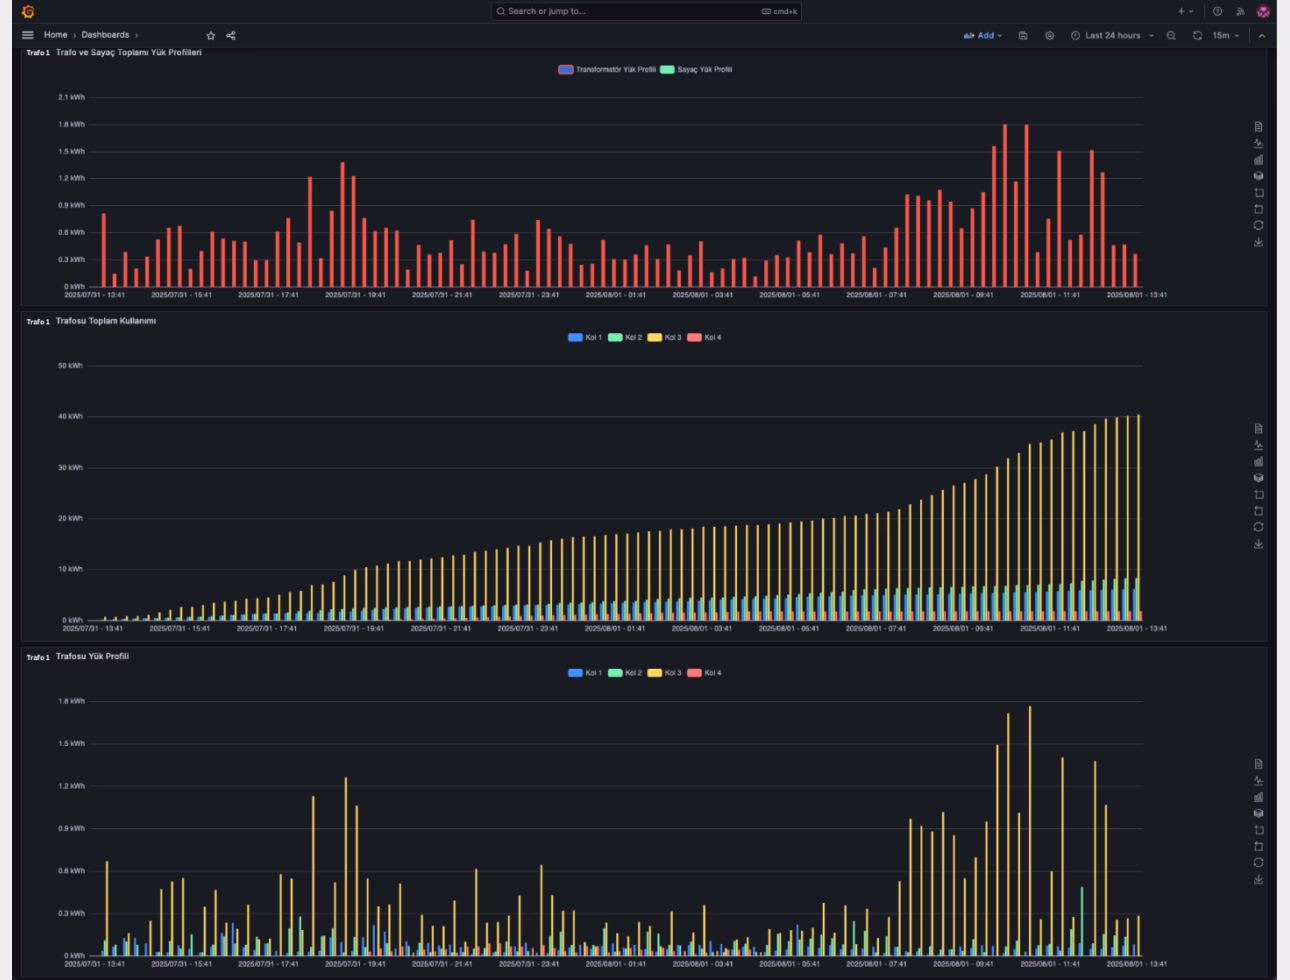
Interactive & Versatile Visualizations: Switch between multiple graph types (e.g., line charts for trends, bar charts for comparisons) to best interpret the data. Also dashboards are fully interactive, with hover-over data points, zoom capabilities, and dynamic legends.
Export & Reporting: Easily export any graph or visualization as a high-quality image file (e.g., PNG), making it simple to include data in reports, presentations, or offline analysis.
Load Profile Analysis: The platform's core capability is providing clear, actionable insights into the load profiles of both transformers and consumers. This is critical for efficient grid management, proactive fault detection, and strategic capacity planning.